Related items

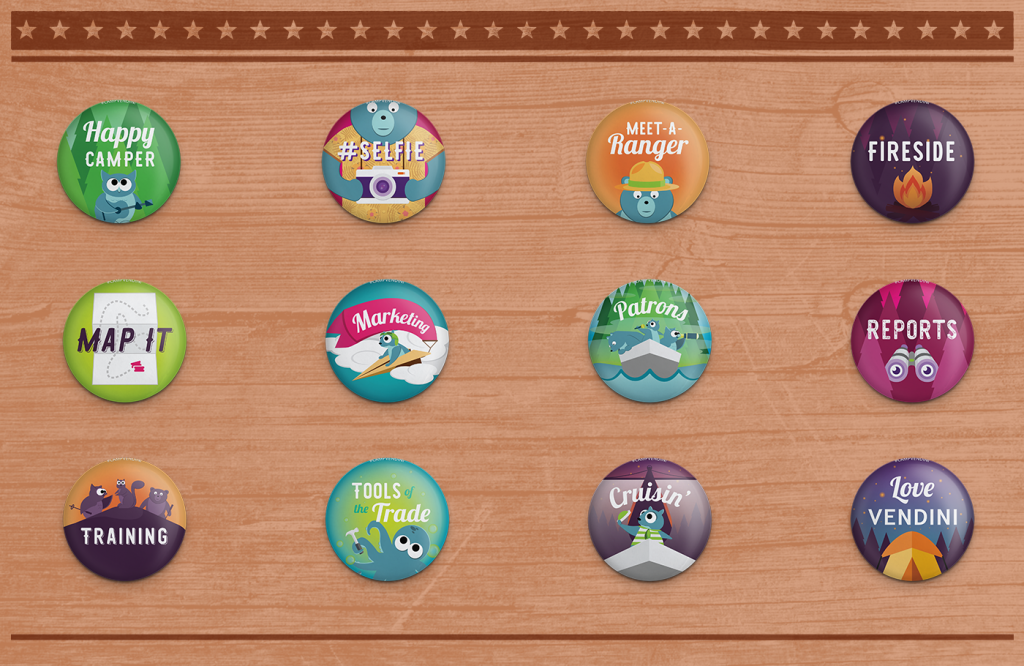
Camp Vendini 2016 Collectible Buttons
From 2013 to 2017, Vendini hosted an annual member conference in which users of the…

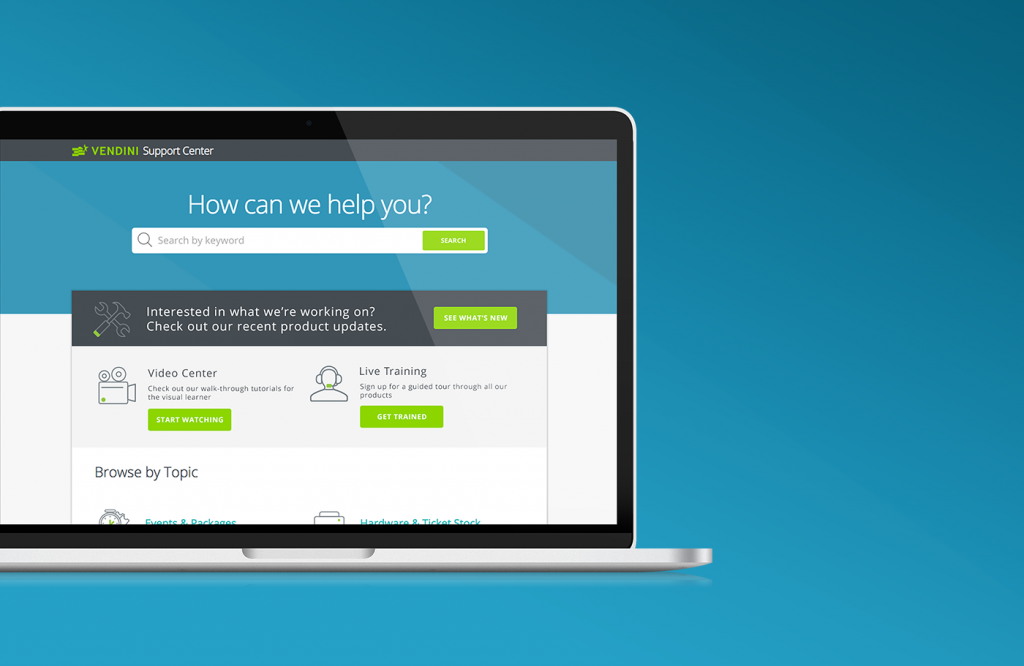
Support Center Website
Vendini’s Support team has two customer-facing sites: a knowledge base where users can find help…
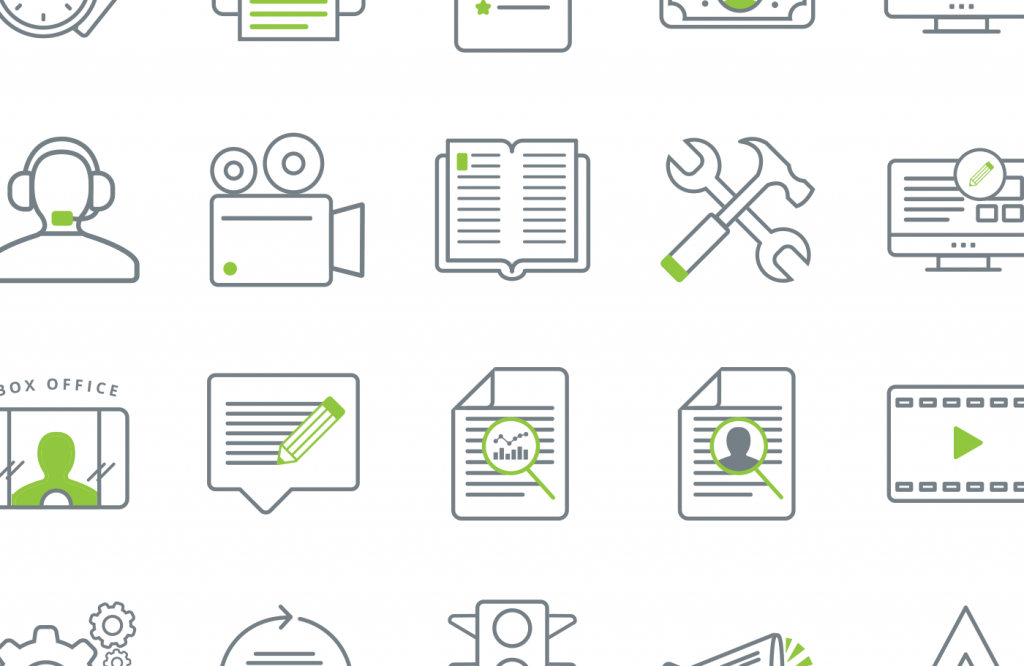
Support Center Icons
Vendini's Support team has two customer-facing sites: a knowledge base where users can find help…

GBS Presentation Template
Developed a powerpoint template as part of an overall brand redesign for an independent bioenergy…