Related items

Vendini Marketing Booklet Design
A 20+ page guide to help members of the Performing Arts community expand their marketing…

Glide Magazine Interview with Vienna Teng
Edited a video for Glide Magazine of indie artist Vienna Teng and her performance of…

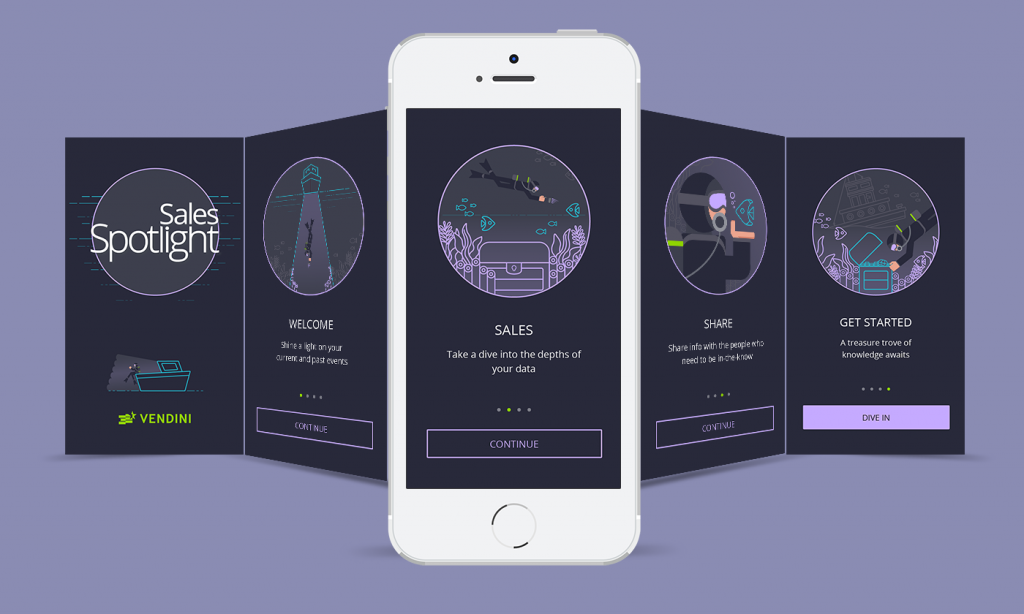
Mobile App Welcome Screens v1
In late 2016, Vendini released their Sales Spotlight app which equips their users with real…

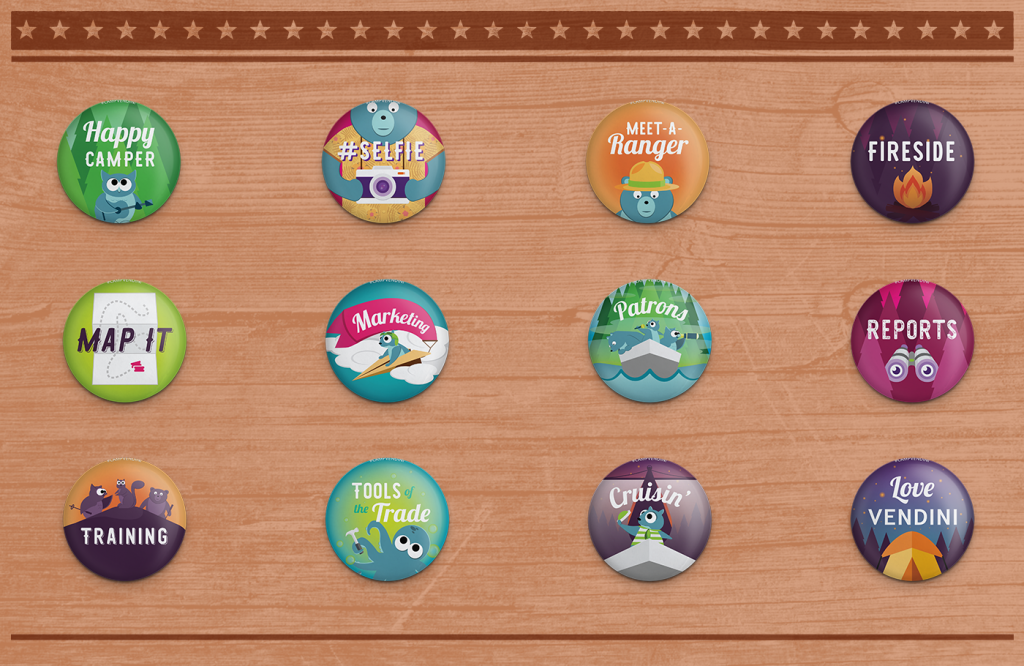
Camp Vendini 2016 Collectible Buttons
From 2013 to 2017, Vendini hosted an annual member conference in which users of the…